
| 描述项 | 内容 |
|---|---|
| 操作系统 | CentOS Linux release 7.9.2009 (Core) |
| 数据库 | 10.5.8-MariaDB-log |
1. 故障现象
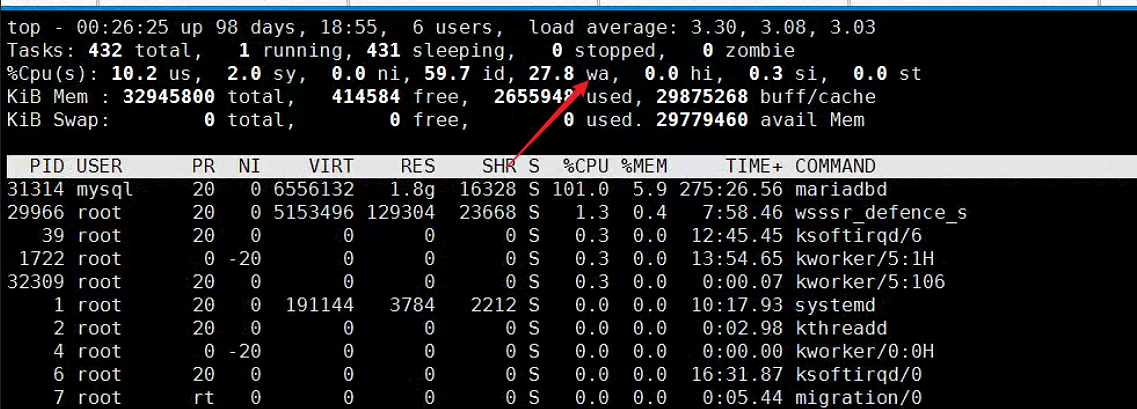
使用 top 命令查看操作系统运行情况时,发现iowait一直处于 30% 左右,如下图所示:
1.1. 系统日志 /var/log/message
Apr  1 16:46:03 gxykt_mariadb1 systemd: mariadb.service: main process exited, code=killed, status=6/ABRT
Apr  1 16:46:04 gxykt_mariadb1 systemd: Unit mariadb.service entered failed state.
Apr  1 16:46:04 gxykt_mariadb1 systemd: mariadb.service failed.
Apr  1 16:46:09 gxykt_mariadb1 systemd: mariadb.service holdoff time over, scheduling restart.
Apr  1 16:46:09 gxykt_mariadb1 systemd: Stopped MariaDB 10.5.8 database server.
Apr  1 16:46:09 gxykt_mariadb1 systemd: Starting MariaDB 10.5.8 database server...
Apr  1 16:46:10 gxykt_mariadb1 mariadbd: 2024-04-01 16:46:10 0 [Note] /usr/local/mysql/bin/mariadbd (mysqld 10.5.8-MariaDB-log) starting as process 20232 ...
Apr  1 16:46:10 gxykt_mariadb1 mariadbd: 2024-04-01 16:46:10 0 [Warning] Could not increase number of max_open_files to more than 16384 (request: 106345)
Apr  1 16:46:32 gxykt_mariadb1 systemd: Started MariaDB 10.5.8 database server.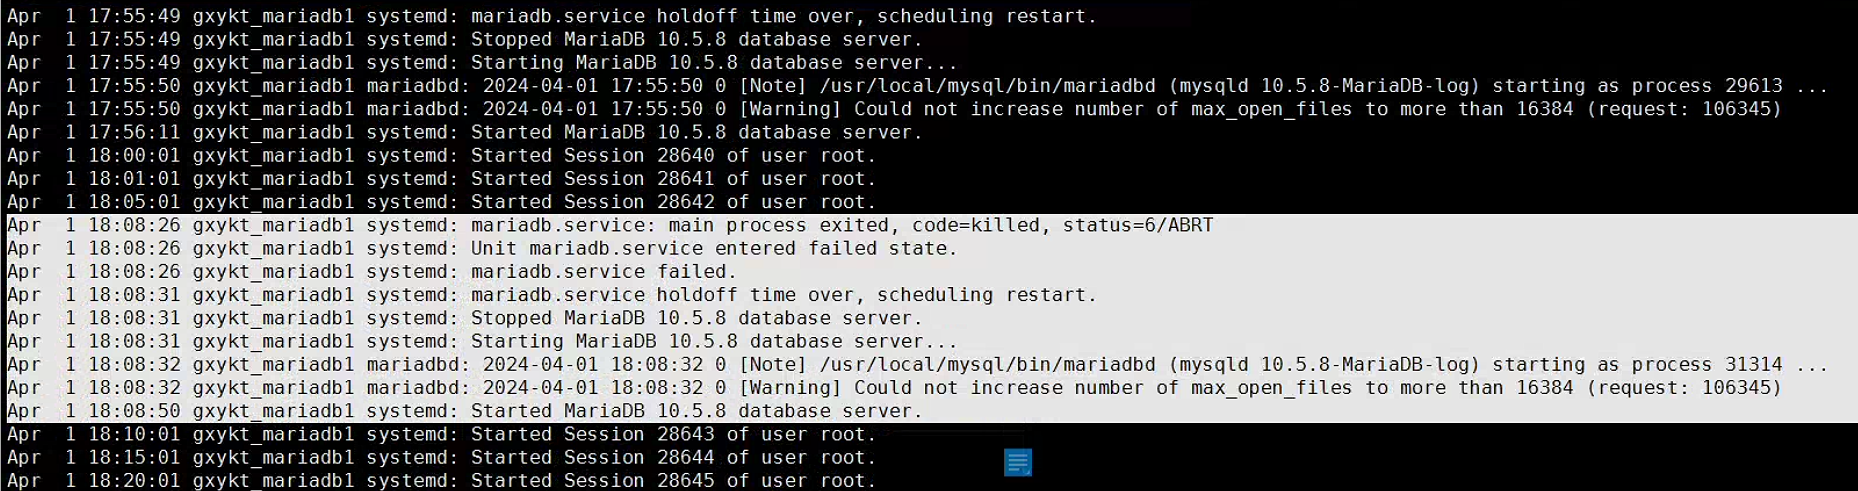
1.2 用mpstat查看cpu情况
]# mpstat -P ALL 1 3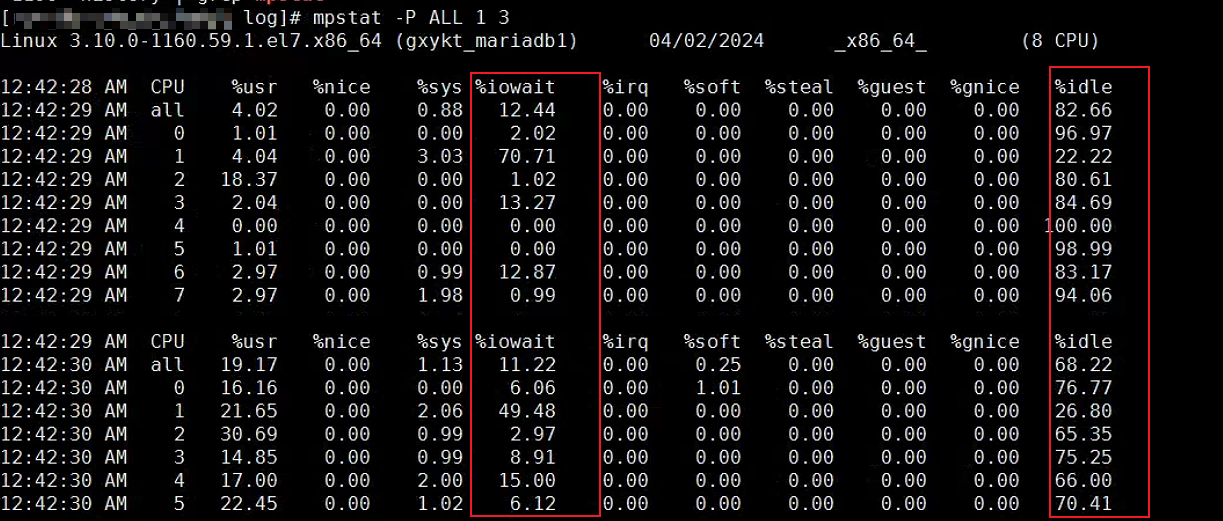

从上图可以看出CPU都在等待IO的完成!
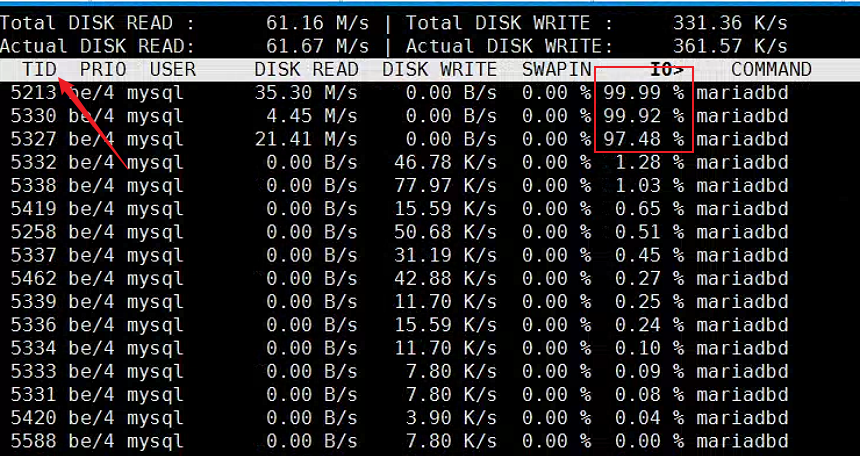
1.3. 使用iotop查询消耗IO的进程
]# iotop -oP
根据PID再找到对应的进程为 mariadb。

1.4. 使用iotop查询消耗IO的线程
~]# iotop -u mysql程序输出包含以下列:
- TID – 进程标识符
- PRIO – 进程优先级
- USER – 拥有进程的用户
- DISK READ – 磁盘读取速度
- DISK WRITE – 磁盘写入速度
- SWAPIN – 已使用交换文件的百分比
- IO> – 所有 I/O 操作的百分比
- COMMAND – 启动进程的命令
1.5. 查询mysql线程与os线程对应关系
mysql里对应 performance_schema.threads 查询mysql线程与os线程对应关系。performance_schema默认是off,没有打开的。通过修改/etc/my.cnf配置文件,设置performance_schema为on,此时performance_schema库就有数据了。

SELECT a.name,
       a.thread_id,
       a.thread_os_id,     -- 操作系统的线程id  (top -H 对应PID,       iotop -u mysql 对应TID)
       a.processlist_id,   -- mysql connection_id()返回的值,可以kill query 或者kill (connection)杀掉。
       a.type,             -- 线程类型,分前台线程和后台线程
       b.user,             -- 用户
       b.host,             -- ip
       b.db,               -- 操作的库名称
       b.command,          -- sql类型
       b.time,             -- sql执行时间 单位:秒
       b.state,            -- sql状态
       b.info              -- sql语句
  FROM performance_schema.threads a
  LEFT JOIN information_schema.processlist b
    ON a.processlist_id = b.id
where a.type = 'FOREGROUND';
1.6. 监控mariadb慢日志

主要是xxl_job数据库中的表xxl_job_log非常多,导致IO等待严重。

xxl_job_log有24G。
1.4. 数据库运行状态
MariaDB [information_schema]> show engine innodb status\G
*************************** 1. row ***************************
  Type: InnoDB
  Name:
Status:
=====================================
2024-04-02 00:36:57 0x7fd49ad73700 INNODB MONITOR OUTPUT
=====================================
Per second averages calculated from the last 42 seconds
-----------------
BACKGROUND THREAD
-----------------
srv_master_thread loops: 22606 srv_active, 0 srv_shutdown, 654 srv_idle
srv_master_thread log flush and writes: 23260
----------
SEMAPHORES
----------
OS WAIT ARRAY INFO: reservation count 197836
OS WAIT ARRAY INFO: signal count 272250
RW-shared spins 186925, rounds 6423901, OS waits 139809
RW-excl spins 49043, rounds 1458357, OS waits 27556
RW-sx spins 20376, rounds 465097, OS waits 5626
Spin rounds per wait: 34.37 RW-shared, 29.74 RW-excl, 22.83 RW-sx
------------------------
LATEST DETECTED DEADLOCK
------------------------
2024-04-01 23:09:37 0x7fd3842d9700
*** (1) TRANSACTION:
TRANSACTION 3830881216, ACTIVE 0 sec fetching rows
mysql tables in use 1, locked 1
LOCK WAIT 5 lock struct(s), heap size 1128, 881 row lock(s), undo log entries 2
MySQL thread id 3724, OS thread handle 140551086012160, query id 27424143 172.16.1.215 dcs Updating
DELETE FROM dcs_device_status_details WHERE (parent_device_num != 0 and parent_device_num = 1725399711149527041)
        OR (parent_device_num = 0 and device_num = 1725399711149527041)
*** (1) WAITING FOR THIS LOCK TO BE GRANTED:
RECORD LOCKS space id 12084 page no 21 n bits 512 index PRIMARY of table `dcsdb`.`dcs_device_status_details` trx id 3830881216 lock_mode X waiting
Record lock, heap no 199 PHYSICAL RECORD: n_fields 6; compact format; info bits 0
 0: len 8; hex 97f1d9e598e11002; asc         ;;
 1: len 1; hex 87; asc  ;;
 2: len 6; hex 0000e4569c2a; asc    V *;;
 3: len 7; hex 060003000c2904; asc      ) ;;
 4: len 8; hex 97f1d9e588211002; asc      !  ;;
 5: SQL NULL;

*** (2) TRANSACTION:
TRANSACTION 3830881322, ACTIVE 0 sec inserting
mysql tables in use 1, locked 1
3 lock struct(s), heap size 1128, 2 row lock(s), undo log entries 1
MySQL thread id 3844, OS thread handle 140546432407296, query id 27424502 172.16.1.215 dcs Update
replace into dcs_device_status_details
        (device_num,status,parent_device_num,content)
        values
            (
            1725399712395235330,7,1725399712114216962,null
            ),
            (
            1725399712395235330,6,1725399712114216962,null
            )
*** (2) HOLDS THE LOCK(S):
RECORD LOCKS space id 12084 page no 21 n bits 512 index PRIMARY of table `dcsdb`.`dcs_device_status_details` trx id 3830881322 lock_mode X locks rec but not gap
Record lock, heap no 199 PHYSICAL RECORD: n_fields 6; compact format; info bits 0
 0: len 8; hex 97f1d9e598e11002; asc         ;;
 1: len 1; hex 87; asc  ;;
 2: len 6; hex 0000e4569c2a; asc    V *;;
 3: len 7; hex 060003000c2904; asc      ) ;;
 4: len 8; hex 97f1d9e588211002; asc      !  ;;
 5: SQL NULL;

*** (2) WAITING FOR THIS LOCK TO BE GRANTED:
RECORD LOCKS space id 12084 page no 21 n bits 512 index PRIMARY of table `dcsdb`.`dcs_device_status_details` trx id 3830881322 lock_mode X locks rec but not gap waiting
Record lock, heap no 198 PHYSICAL RECORD: n_fields 6; compact format; info bits 32
 0: len 8; hex 97f1d9e598e11002; asc         ;;
 1: len 1; hex 86; asc  ;;
 2: len 6; hex 0000e4569ab3; asc    V  ;;
 3: len 7; hex 280005166212e5; asc (   b  ;;
 4: len 8; hex 97f1d9e588211002; asc      !  ;;
 5: SQL NULL;

*** WE ROLL BACK TRANSACTION (2)
------------
TRANSACTIONS
------------
Trx id counter 3831962857
Purge done for trx's n:o < 3831912798 undo n:o < 0 state: running
History list length 22299
LIST OF TRANSACTIONS FOR EACH SESSION:
---TRANSACTION 422027972220040, not started
0 lock struct(s), heap size 1128, 0 row lock(s)
...此处有省略
0 lock struct(s), heap size 1128, 0 row lock(s)
---TRANSACTION 422027972275888, ACTIVE 10 sec fetching rows
mysql tables in use 2, locked 0
0 lock struct(s), heap size 1128, 0 row lock(s)
MySQL thread id 4775, OS thread handle 140552033396480, query id 35615239 172.16.1.213 xxl_job Sending data
SELECT
            t.id
        FROM
            xxl_job_log t
            LEFT JOIN xxl_job_registry t2 ON t.executor_address = t2.registry_value
        WHERE
            t.trigger_code = 200
                AND t.handle_code = 0
                AND t.trigger_time   <=   '2024-04-02 00:26:47'
                AND t2.id IS NULL
Trx read view will not see trx with id >= 3831960932, sees < 3831960932
---TRANSACTION 422027972164192, not started
0 lock struct(s), heap size 1128, 0 row lock(s)
---TRANSACTION 422027972159896, not started
0 lock struct(s), heap size 1128, 0 row lock(s)
---TRANSACTION 422027972391880, not started
0 lock struct(s), heap size 1128, 0 row lock(s)
---TRANSACTION 422027972018128, ACTIVE 299 sec fetching rows
mysql tables in use 1, locked 0
0 lock struct(s), heap size 1128, 0 row lock(s)
MySQL thread id 4709, OS thread handle 140547840562944, query id 35214742 172.16.1.213 xxl_job Sending data
SELECT id FROM `xxl_job_log`
        WHERE !(
            (trigger_code in (0, 200) and handle_code = 0)
            OR
            (handle_code = 200)
        )
        AND `alarm_status` = 0
        ORDER BY id ASC
        LIMIT 1000
Trx read view will not see trx with id >= 3831912797, sees < 3831912797
---TRANSACTION 422027972189968, ACTIVE 71 sec
0 lock struct(s), heap size 1128, 0 row lock(s)
MySQL thread id 4691, OS thread handle 140552300525312, query id 35496080 172.16.1.213 bcpf
Trx read view will not see trx with id >= 3831948572, sees < 3831948571
---TRANSACTION 422027972473504, not started
0 lock struct(s), heap size 1128, 0 row lock(s)
...
---TRANSACTION 422027972546536, ACTIVE 0 sec
0 lock struct(s), heap size 1128, 0 row lock(s)
MySQL thread id 135, OS thread handle 140547845355264, query id 35635716 172.16.1.215 uias_user_center
---TRANSACTION 422027971979464, not started
0 lock struct(s), heap size 1128, 0 row lock(s)
...(此处省略)
---TRANSACTION 422027971936504, not started
0 lock struct(s), heap size 1128, 0 row lock(s)
--------
FILE I/O
--------
I/O thread 0 state: (null) ((null))
...(此处省略)
I/O thread 33 state: (null) ((null))
Pending normal aio reads:
Pending flushes (fsync) log: 0; buffer pool: 0
52679899 OS file reads, 6134426 OS file writes, 2647297 OS fsyncs
2 pending reads, 0 pending writes
1902.50 reads/s, 16368 avg bytes/read, 223.99 writes/s, 98.71 fsyncs/s
-------------------------------------
INSERT BUFFER AND ADAPTIVE HASH INDEX
-------------------------------------
Ibuf: size 253, free list len 12060, seg size 12314, 28451 merges
merged operations:
 insert 159252, delete mark 48291, delete 41
discarded operations:
 insert 0, delete mark 0, delete 0
0.00 hash searches/s, 30051.78 non-hash searches/s
---
LOG
---
Log sequence number 2923499223626
Log flushed up to   2923499223543
Pages flushed up to 2923406113816
Last checkpoint at  2923406113816
0 pending log flushes, 0 pending chkp writes
2047572 log i/o's done, 86.81 log i/o's/second
----------------------
BUFFER POOL AND MEMORY
----------------------
Total large memory allocated 671088640
Dictionary memory allocated 4240320
Buffer pool size   32260
Free buffers       0
Database pages     32260
Old database pages 11889
Modified db pages  4137
Percent of dirty pages(LRU & free pages): 12.824
Max dirty pages percent: 75.000
Pending reads 2
Pending writes: LRU 0, flush list 0
Pages made young 688055, not young 256506565
12.33 youngs/s, 12258.04 non-youngs/s
Pages read 52527064, created 218497, written 3967535
1902.67 reads/s, 24.79 creates/s, 135.43 writes/s
Buffer pool hit rate 988 / 1000, young-making rate 0 / 1000 not 70 / 1000
Pages read ahead 0.00/s, evicted without access 0.00/s, Random read ahead 0.00/s
LRU len: 32260, unzip_LRU len: 0
I/O sum[94432]:cur[3585], unzip sum[0]:cur[0]
--------------
ROW OPERATIONS
--------------
3 read views open inside InnoDB
Process ID=0, Main thread ID=0, state: sleeping
Number of rows inserted 1732345, updated 1010939, deleted 646156, read 18365155605
36.57 inserts/s, 49.62 updates/s, 28.24 deletes/s, 743763.60 reads/s
Number of system rows inserted 0, updated 0, deleted 0, read 0
0.00 inserts/s, 0.00 updates/s, 0.00 deletes/s, 0.00 reads/s
----------------------------
END OF INNODB MONITOR OUTPUT
============================
1 row in set (0.001 sec)